Know what every AU clinic runs before you call.
Tech stacks, firmographics and change signals for 28,612 clinic locations. Filter by PMS, booking platform, ad pixels, clinic type, state and size. Refreshed every weekend.
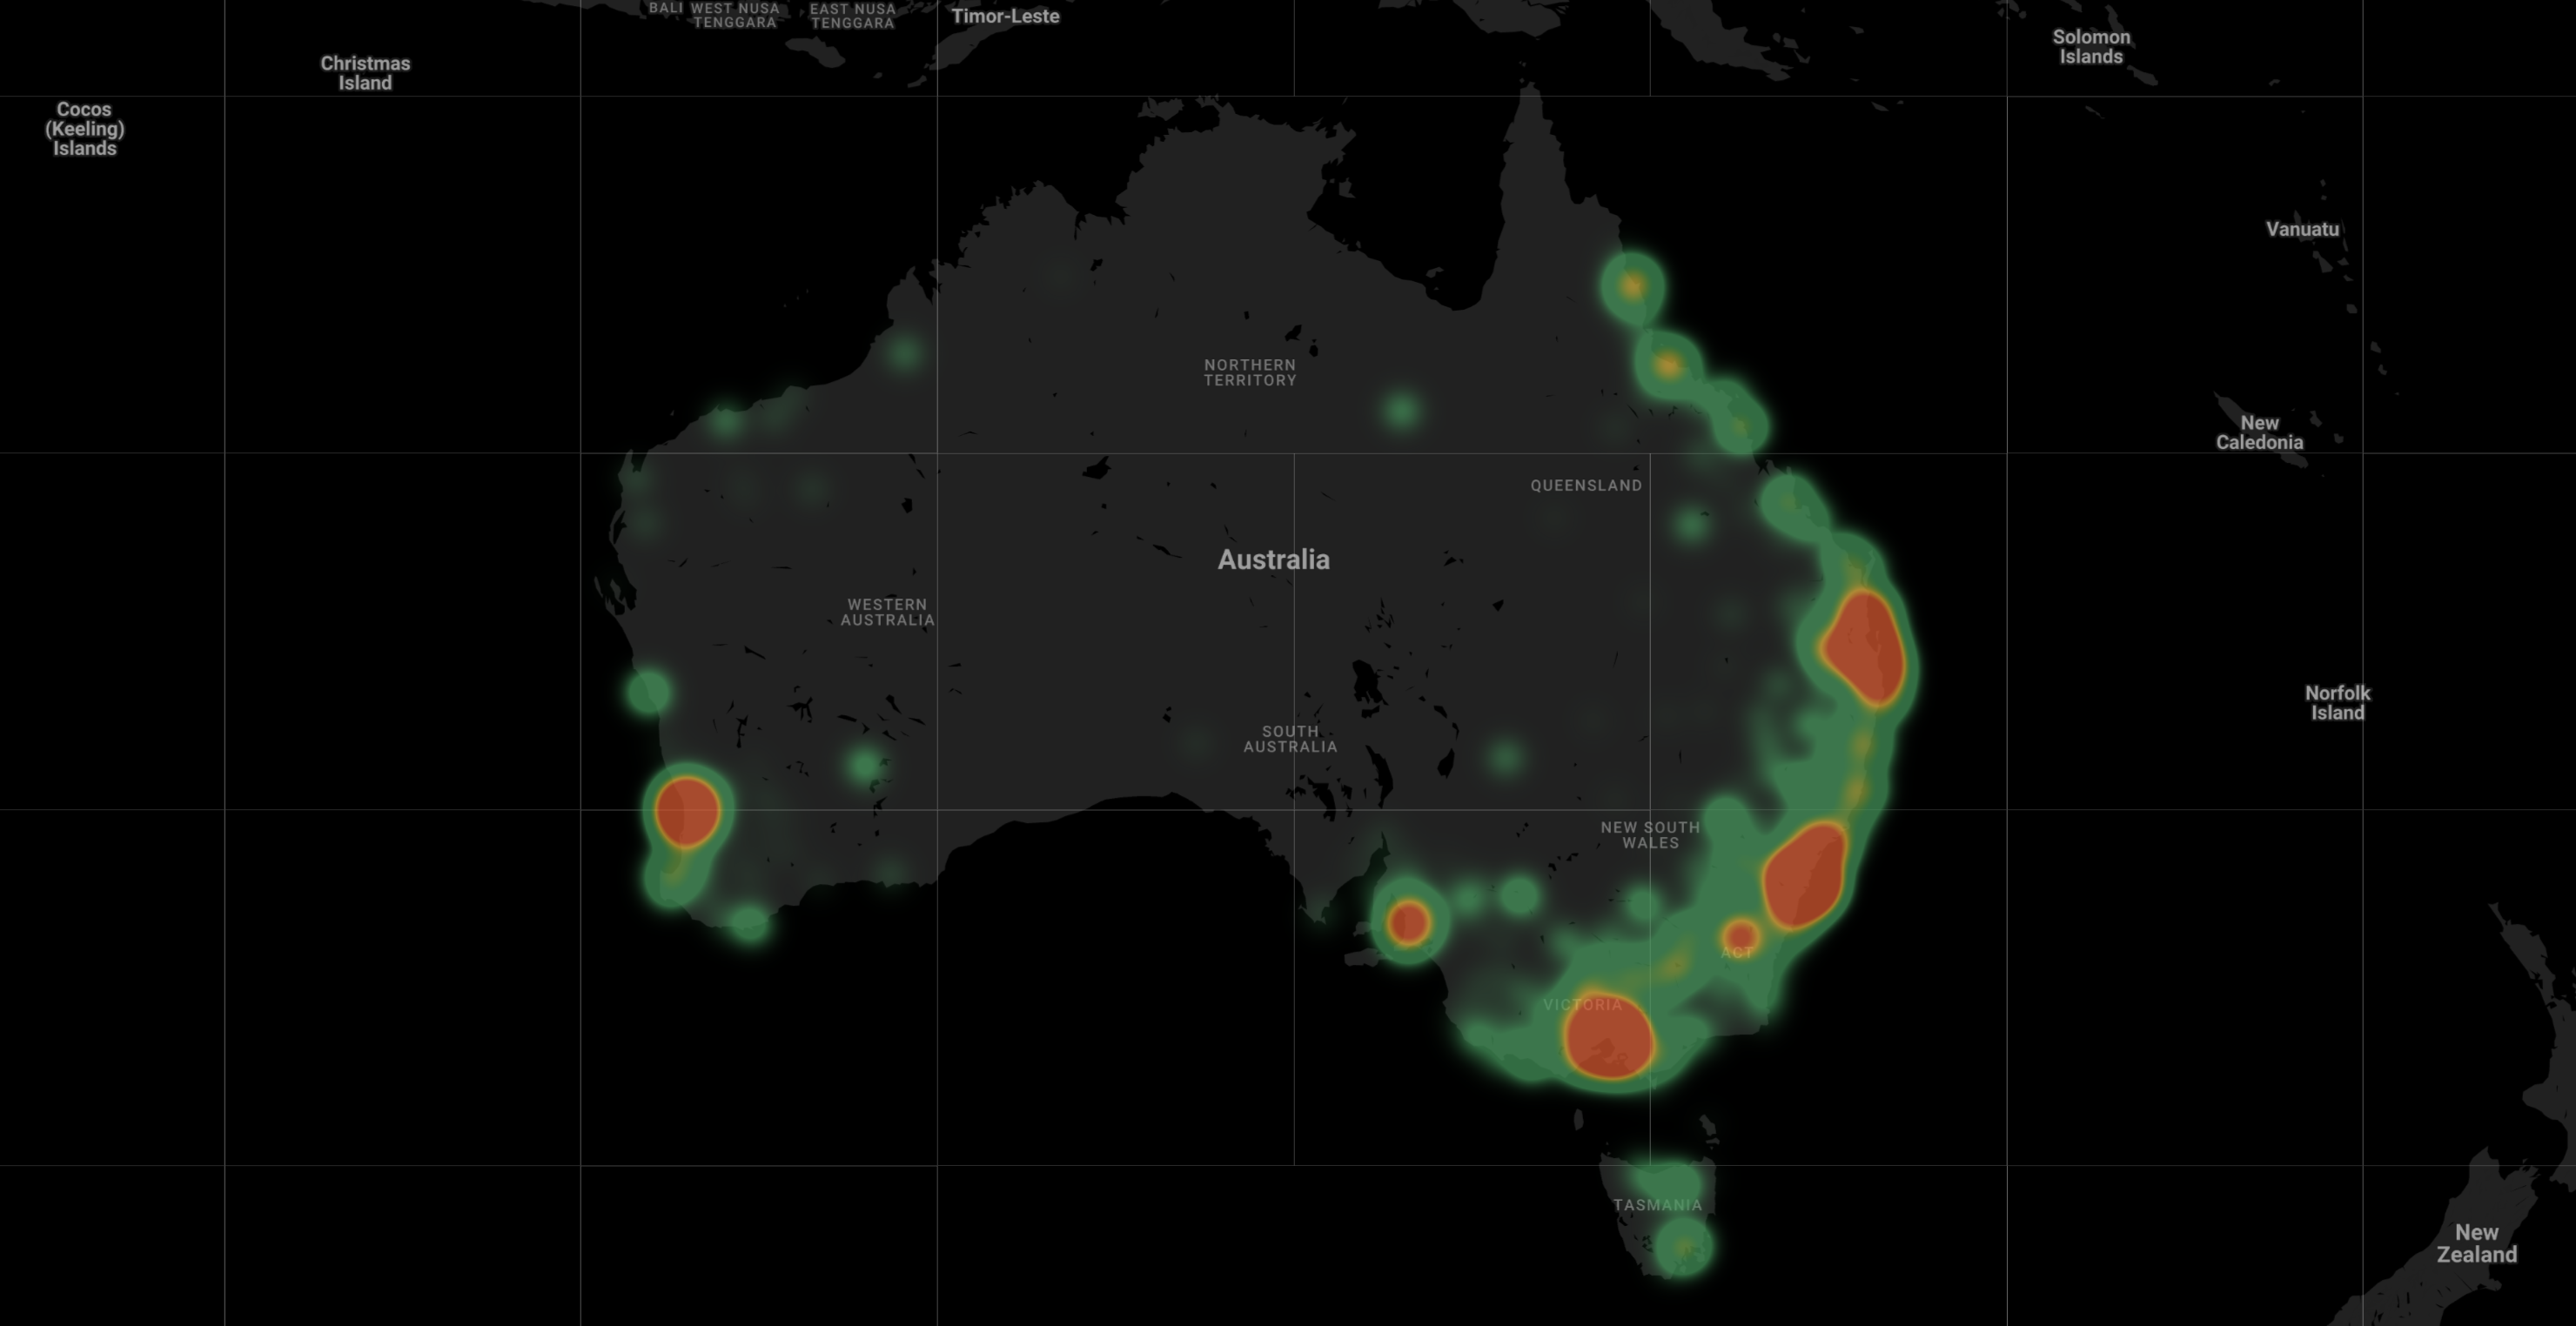
Full Australia-Wide Coverage
Every state and territory mapped, from metro hubs to regional and rural clinics. No geographic gaps.
The Greenfield Opportunity
82.1% of clinics offer online booking, but only 59.4% use a dedicated platform. Most of the market is untouched.
What You Can Ask
Tell us your ICP. We run the query.
"All Dentists in NSW currently using Dental4Windows but NOT using a CRM."
"All clinics with 6+ practitioners that have an active Meta Ad Pixel."
"Alert me the week a clinic removes HotDoc or HealthEngine from their website."
"Alert me when a high-volume clinic (10+ practitioners) drops below a 4.2 Google rating."
Digital Maturity
What tech categories clinics are using and where the gaps are.
20-Clinic Free Sample
See exactly how the data is structured. Includes the full data dictionary and 20 real clinic rows.
View Data Dictionary & SampleData Delivery Models
Monthly Feed
RecurringFull baseline extract on day 1, then monthly diffs flagging what changed. New clinics, tool switches, rating drops — delivered every month.
Weekly Feed
PremiumSame as monthly but refreshed every week. For teams that need to move fast — PMS migrations, booking tool switches, new clinic signals within days.
One-Shot Extract
StaticA filtered dataset matching your ICP. Used for TAM sizing, territory planning and outbound campaign loading.
Monthly feed from AUD 1,500/mo. Weekly feed from AUD 2,500/mo. One-shot extract from AUD 2,500. Final price depends on segment size and filters.
What Else Is Available
Owner and director names with verified emails
Filtered datasets matching your exact ICP
Any combo of state, type, tech and size
Alerts when clinics drop below a threshold
Know when a clinic switches or drops a tool
See who runs Google Ads, Meta Ads or both
Need a field we don't track? We'll add it
If it's on a clinic website, we can find it
TAM by Clinic Category
10 clinic verticals. Dentistry is highly fragmented (1.3 locations/brand), Audiology is heavily consolidated (5.7 locations/brand).
| Category | Locations | Unique Domains | % of Total |
|---|---|---|---|
| Psychologist | 5,081 | 4,395 | 17.8% |
| Dentist | 4,272 | 3,242 | 14.9% |
| Chiropractor | 3,222 | 2,450 | 11.3% |
| Medical Clinic | 2,439 | 1,962 | 8.5% |
| Audiologist | 2,081 | 363 | 7.3% |
| Podiatrist | 2,001 | 1,322 | 7.0% |
| Optometrist | 1,549 | 832 | 5.4% |
| Occupational Therapist | 1,407 | 1,024 | 4.9% |
| Osteopath | 1,380 | 1,141 | 4.8% |
| Speech Pathologist | 1,267 | 1,025 | 4.4% |

Alexandre Kocev
Account Executive
Questions about coverage, pricing, or a custom segment? Reach out directly.
Request a Custom Quote
Tell us your ICP and we'll run a free market sizing count and send you pricing.